Dashboard Update: Insulin Tracking and Pump Integration
January 27, 2026
This is Part 2. Part 1 covers building the dashboard from scratch.
The family dashboard got smarter. It now shows insulin delivery patterns alongside glucose readings. Five days of insulin totals, bolus vs basal breakdown, and integration with Abigail’s insulin pump through Glooko.
Since building the dashboard, I’ve been iterating on the display. The glucose sparkline was useful, but diabetes management is about more than glucose. Insulin timing and dosing matter just as much. Could I get pump data onto the display too? Yes!
Getting Pump Data
Dexcom handles glucose. But insulin comes from a different system entirely. Abigail uses an Insulet Omnipod 5 insulin pump, which syncs to an app called Glooko. Glooko aggregates data from the pump: bolus doses, basal delivery, carb entries. All the treatment data that helps explain why glucose goes up or down.
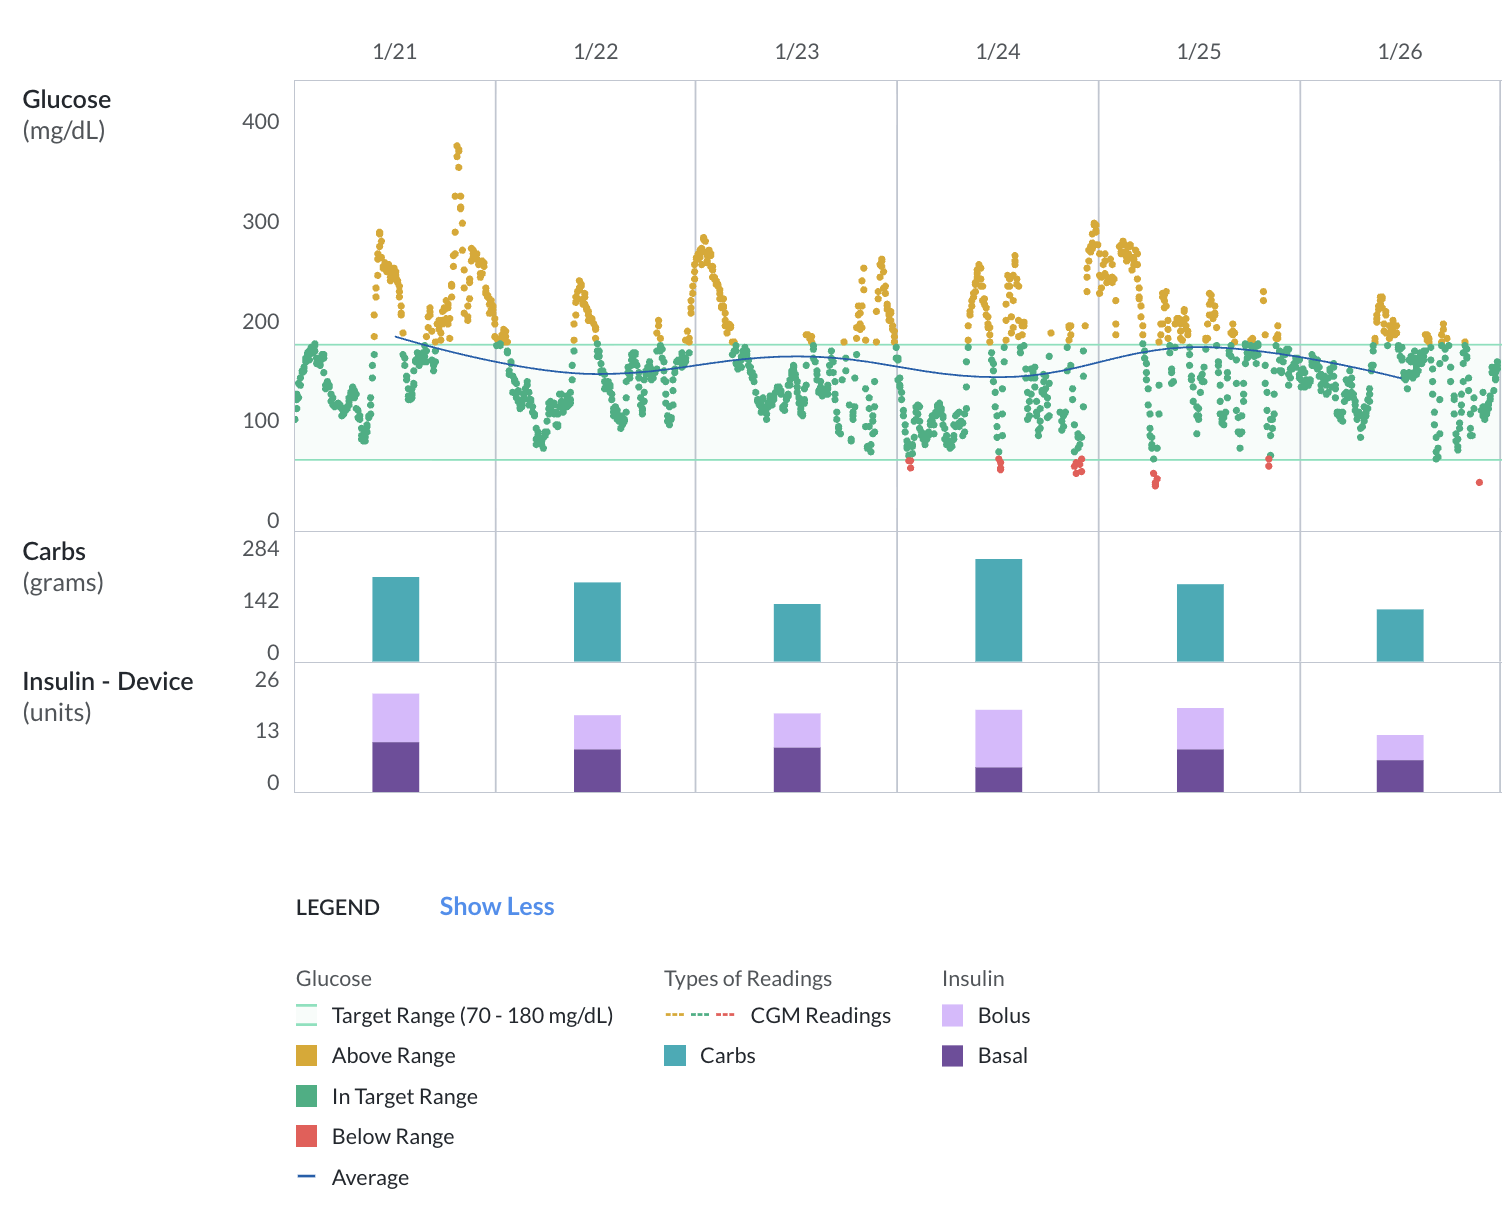 Glooko’s web dashboard: glucose readings up top, carbs in the middle, insulin at the bottom with bolus (light purple) and basal (dark purple) stacked.
Insulet doesn’t have a public API, but they do share data with Glooko—which doesn’t have a public API either, but does have a CSV export in their web UI. No API? No problem. I built a web scraper.
A Lambda function runs Puppeteer with headless Chrome. It logs into Glooko, navigates to the export page, downloads a CSV archive, and parses the treatment data. The whole thing runs hourly on a schedule. Puppeteer in Lambda requires some gymnastics (@sparticuz/chromium for the binary, 1GB of memory for Chrome), but it works reliably.
The scraper extracts everything: bolus doses, basal rates, carb entries, even alarm events from the pump. All of it goes into DynamoDB with idempotent writes, building a historical diabetes database over time. Same data, same key, no duplicates.
Five Days of Insulin at a Glance
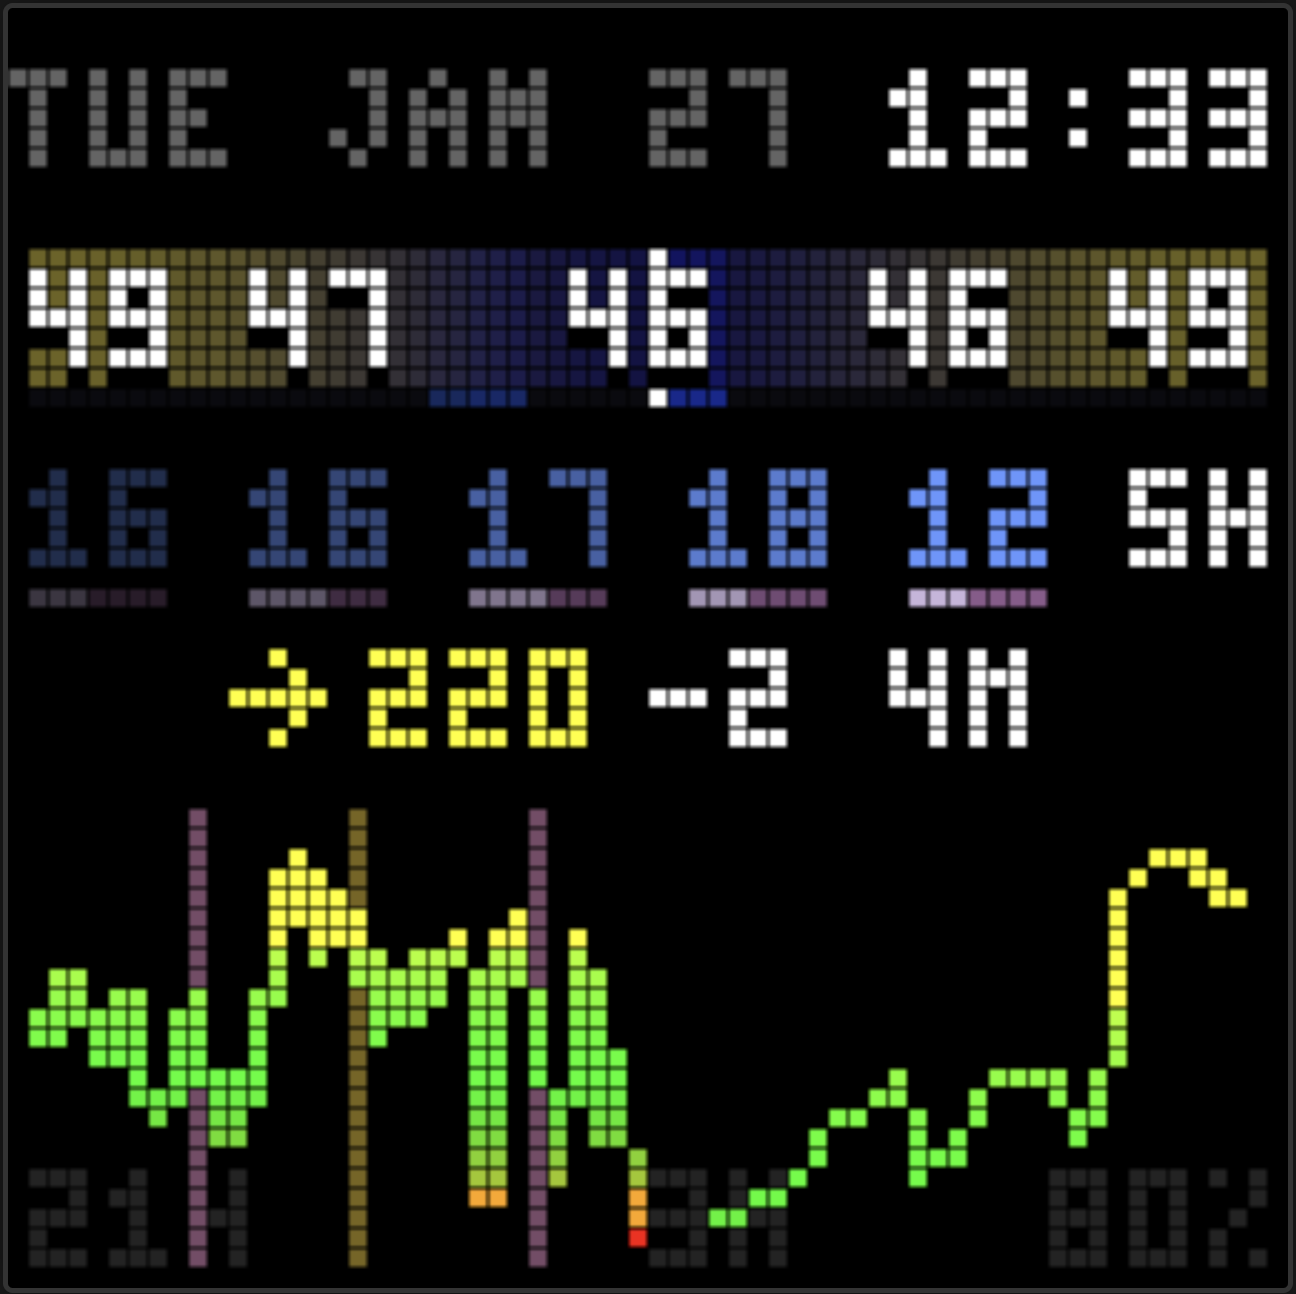
The display now shows five days of insulin totals in a row. Each number shows total insulin for that day—bolus plus basal combined. A brightness gradient makes the pattern clear: oldest on the left (dim), newest on the right (bright).

Below each number, a tiny ratio bar shows the bolus/basal split. Light purple for bolus, dark purple for basal. The bar width represents 100% of that day’s insulin. At a glance, I can see if the split is typical (roughly 50/50) or unusual.
The colors match Glooko’s own charts. Familiar visual language.
After the five totals, a latency indicator shows how fresh the bolus data is. “5m” means the last known bolus was 5 minutes ago. “2h” means we’re flying blind for a while. Useful context.
Time in Range

I also added TIR—Time in Range—to the glucose sparkline. It’s a standard diabetes metric: what percentage of readings fall within the target range (70-180 mg/dL) over the last 24 hours? The number appears in the corner of the chart. Quick insight into how the day is going.
= 70% TIR is generally considered good. Higher is better. Seeing the number on the display makes it ambient. No need to open an app.
Compact Everything
The original display used a 5x7 pixel font. Fine for readability, but it ate vertical space. I switched everything to a 3x5 font. Same information, fewer pixels. The sparkline chart grew from 21 pixels tall to 23. More room for trend detail.
Keeping it Simple
Since my last writeup, I added and then removed Oura readiness scores. Nice idea and looked neat, but I wasn’t finding them useful in practice. The display should show what matters. For diabetes management, that’s glucose and insulin.
Still Running Cheap
The scraper adds a bit to the AWS bill—Puppeteer needs more memory than a typical Lambda—but the whole system still runs for about $4/month.
What’s Next
The dashboard now covers glucose and insulin. The two main variables in diabetes management. Having them side by side on a glanceable display feels right.
I’m thinking about adding carb totals next. The data is already there from Glooko. Just needs a place on the display.
The scraper is also building a historical diabetes database in DynamoDB. Months of glucose, insulin, and carb data, all queryable. I’m curious what insights might emerge from pointing Claude Opus 4.5 at the trends—an AI endocrinologist on AWS Bedrock, offering succinct observations about patterns in the data? That’d be cool. 😎
The code is still open source on GitHub.
Update: Part 3 adds an AI insights agent.
– John