Dashboard Update: An AI Friend Who Watches the Numbers
February 2, 2026
This is Part 3. Part 1 covers building the dashboard. Part 2 adds insulin tracking.
The dashboard has a new feature: an AI that watches the glucose and insulin data, then offers short observations on the display. Not commands or clinical alerts, just a friendly voice that notices patterns we might miss.
Why an Insights Agent
Managing T1D means interpreting numbers constantly. Is this a trend or a blip? Did lunch hit harder than expected? Are overnight lows becoming a pattern? We do this interpretation all the time, but we can’t watch every moment (we try though).
I wanted a second set of eyes and some validation. Something that could look at the last few hours (glucose, insulin, carbs) and surface one helpful observation. Not a diagnosis or medical advice, just a nudge, “steady all morning, nice!” or “rising after lunch, pre-bolus next time?”
What It Feels Like
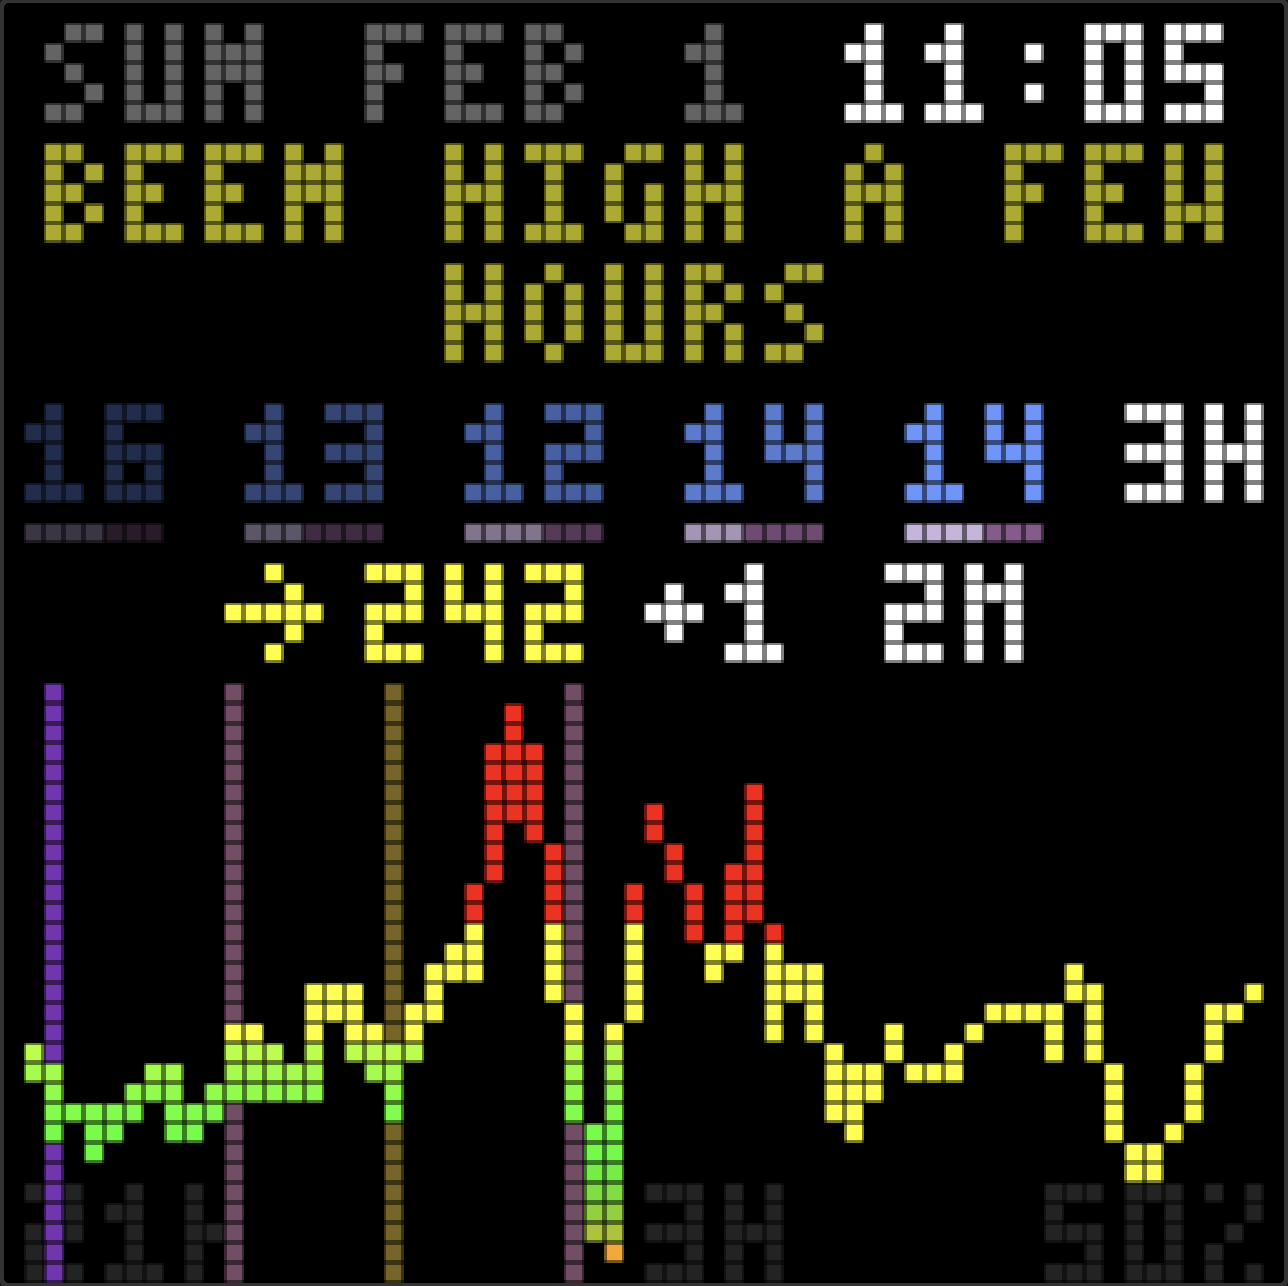
The display now has a voice. Glancing at it in the morning: “great overnight!” in green, a small celebration. After a rough lunch: “been high a while, bolus?” as a gentle check-in. Three days of tight control: “3 days in range!” cycling through rainbow colors.
It’s not a medical device. It’s not trying to be a doctor. It’s more like a friend who pays attention. Another person on the team that notices the patterns. A supportive cheer for the wins and gentle questions about the struggles.
The Hard Part: Making It Human
Thanks to Claude Code, getting the agent working was easy. It took most of the day, chugging away with me stopping to give feedback every 30 minutes or so, but it didn’t take much input from me to get going. Getting it to sound human took some tweaking and is where I felt my value to the project.
Claude’s first attempt yielded abbreviations. “Hi 4h avg230 now241”. Readable if you studied it, but robotic. It was building a telegraph, not a friend.
Second attempt: natural language with exact numbers. “Glucose 241, been high 3 hours, consider bolus.” Better, but clinical. Felt like a medical device, not a companion.
I kept giving feedback: more ranges, more questions, some color, gentle. Instead of “241,” say “over 200.” Instead of “need bolus,” ask “bolus?” A caring friend suggests, doesn’t command. The difference between “you should eat” and “hungry?” is everything when things are already suboptimal.
The final prompt required explicit FORBIDDEN examples. I literally had to tell Claude that “Hi 4h avg230” was “robotic garbage.” Subtle guidance wasn’t enough but we got there!
Colors for Emotion
Plain white text couldn’t convey tone. A celebration looked the same as a warning.
I added color markup the agent can use. Green for celebrations and wins. Yellow for caution when running high. Red for urgent situations like lows. And rainbow for big wins, cycling through colors character by character.
“steady all day!” in green hits different than plain white text. The display becomes expressive.
Colors are muted, about two-thirds brightness, so they don’t compete with the glucose reading. The number is still the star. The insight is a whisper, not a shout.
The Constraints
The LED display has room for two lines of about 15 characters each. 30 characters total. Every word counts.
The agent often generated 40, 50, even 80 characters despite the prompt. I added a retry loop: if the insight is too long, ask the agent to shorten it. Same session, same context, just “that was 45 chars, please make it 30.” Works most of the time. Force-truncate as a fallback.
Two lines also need to look balanced. “BEEN HIGH A FEW” + “HOURS” looks awkward. “BEEN HIGH A” + “FEW HOURS” looks intentional. The compositor now splits short text near the middle.
How It Works
I used this as an opportunity to learn AWS Bedrock Agents, something we’re also embracing at work. The agent runs Claude Sonnet 4.5 with access to the diabetes data in DynamoDB. It can query glucose readings, insulin doses, carb entries, and computed stats like Time in Range. Then it stores a short insight for the display.
DynamoDB Streams trigger the agent when new data arrives. Event-driven, not hourly cron. When Abigail’s CGM sends a new reading or Glooko syncs pump data, the agent runs within seconds.
What It Costs
The insights agent changed the economics. The original dashboard ran for about $4/month. With the agent analyzing every CGM reading, costs jumped significantly.
CGM readings arrive every 5 minutes, 288 times per day. Each agent invocation uses Claude Sonnet 4.5 on Bedrock at $3 per million input tokens and $15 per million output tokens. With the prompt, data queries, and responses, that adds up to roughly $40-50/month for the agent alone.
Worth it for us. The supportive nudges and pattern recognition add real value to daily diabetes management. But it’s no longer a $4/month hobby project.
What’s Next
That 10x cost jump needs work. Right now the agent runs on every CGM reading, even at 3am when we’re asleep and the numbers are steady. Smarter would be: only generate new insights when glucose moves significantly, or when it’s been a while, or when we’re probably awake. No need to pay Claude to tell a sleeping house that everything’s fine. (Though I appreciate the sentiment.)
I’ll keep tweaking the prompt too. The voice is close but not perfect. More feedback, more iterations.
Stepping back from the display itself, there’s a bigger opportunity here. The agent already has access to weeks of glucose, insulin, and carb data. Why stop at 30-character insights on an LED?
Morning email reports summarizing how overnight went. Weekly trends with suggestions to try. Coaching on carb ratios and bolus timing. “You’ve been running high after breakfast three days in a row. Want to try a 10% increase in your morning ratio?” The data is there. The reasoning is there. The interface could be anything.
For more complex workflows, AWS has AgentCore, a newer framework for building multi-agent systems. Could be fun to explore for coordinating analysis, recommendations, and delivery across different channels.
I’m excited to keep building. AI tools for diabetes management feel like exactly the kind of thing I want to spend time on. Personal, useful, iterative. A fun excuse to keep learning and a real way to help my family.
Still open source on GitHub.
Part 4 refines the insights after a stressful night.
– John