Glucagent: A Daily Diabetes Digest
March 25, 2026
My daughter Abigail has Type 1 diabetes. Her body doesn’t produce insulin, so we manage it externally: an insulin pump delivers a steady background drip (basal), and she gets additional doses (boluses) at meals based on how many carbs she’s eating. A continuous glucose monitor (CGM) on her arm reads her blood sugar every five minutes and sends it to our phones. The goal is keeping glucose between 70 and 180 mg/dL, a metric called Time in Range (TIR).
I’ve been building tools around this data for a while now. The LED display series shows what’s happening in real time: glucose, trends, weather, short AI observations on a 64x64 pixel grid. It’s great for glancing at while we’re home.
Being a Type 1 diabetes (T1D) caregiver means constantly analyzing data. “Why did she spike after lunch?” “Was that low from too much insulin or not enough food?” “Is this week better or worse than last week?” The display shows what’s happening now. I wanted something that explains what happened yesterday and why. The kind of analysis we’d do ourselves if we had time to sit down with a spreadsheet every morning, backed by all the diabetes knowledge in the best frontier model I can access.
So I built Glucagent. Every morning at 7:15, Courtney and I get an email. Claude reads Abigail’s last 24 hours of glucose, insulin, and carb data from two sources: her Dexcom G7 CGM for glucose readings every five minutes, and Glooko for insulin and carb data from her Insulet Omnipod 5 pump. It compares yesterday against the week and writes a report.
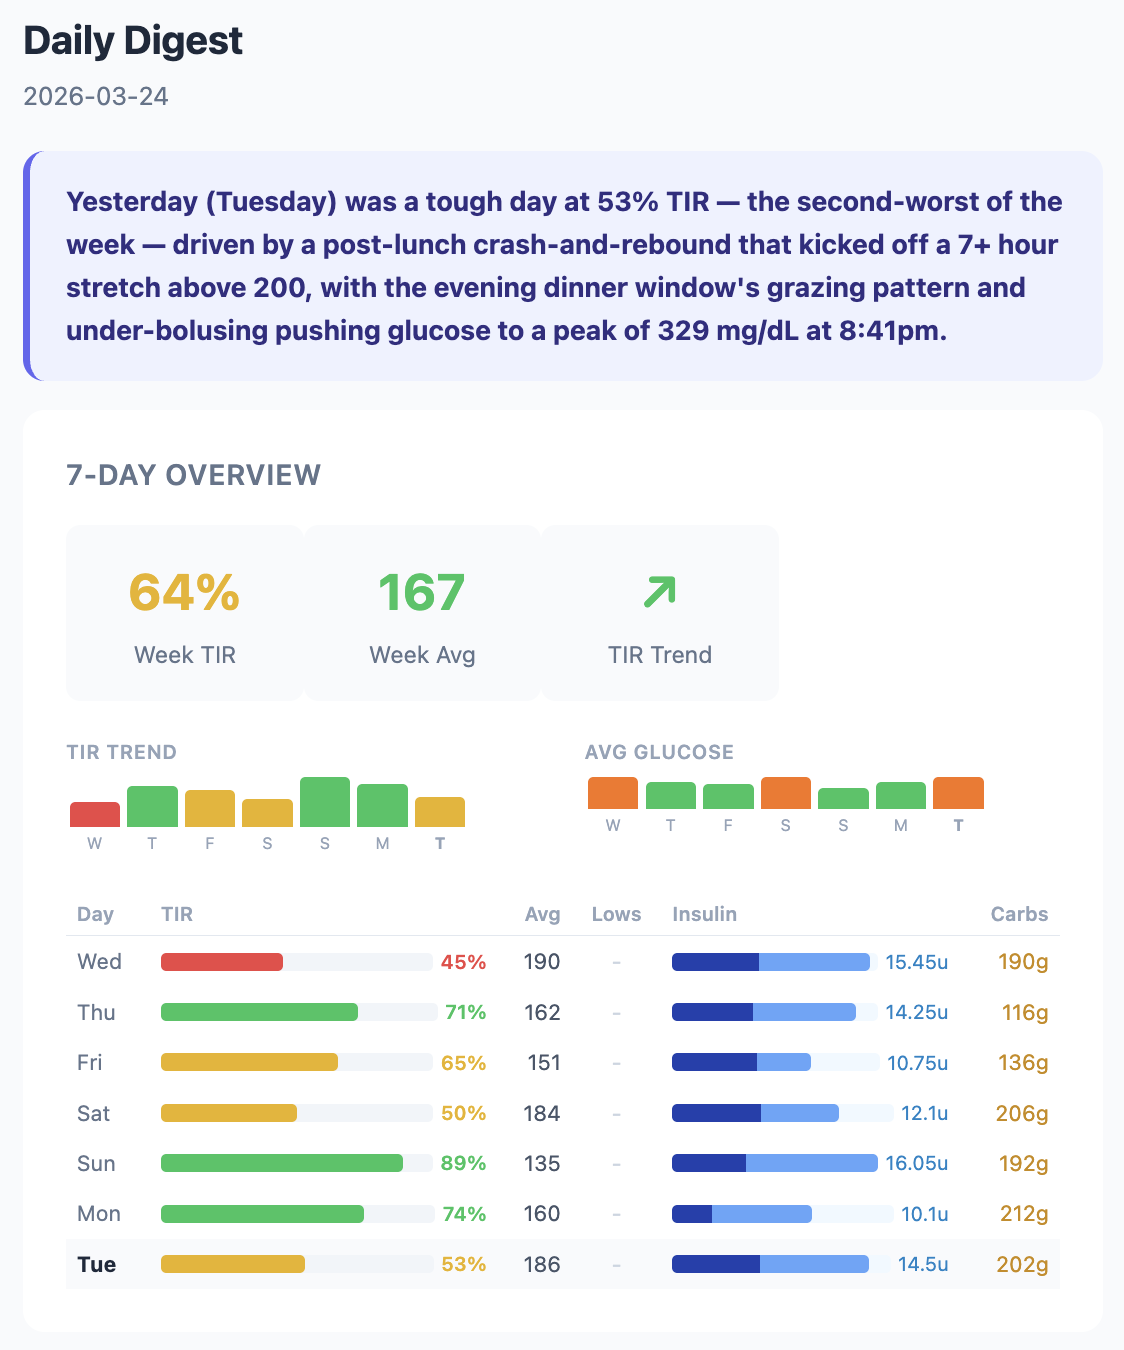
What the Email Looks Like
Claude’s analysis is broken into five sections. A one-sentence Quick Take captures the most important thing about yesterday. What the Week Shows puts yesterday in context against the seven-day trend, comparing carb ratios, correction frequency, and basal patterns across days. Yesterday Deep Dive walks through the day chronologically, connecting specific insulin doses to specific glucose responses. Pattern Insight offers one data-backed observation, like a timing mismatch between insulin action and carb absorption. And The Human Side ties encouragement to specific data points so it feels earned, not generic.
The prompt tells Claude to act as an endocrinologist, diabetes coach, and mental health ally. It gets the full 7-day data table, yesterday’s complete timeline of CGM readings and bolus events, the previous day’s analysis for continuity, and sensor health data. Never prescriptive (no dosing advice), but educational.
Sensor Integrity Detection
Not all CGM data is trustworthy. Sensors get noisy, especially in the beginning and end of their 10 day lifespan, or when compressed during sleep. Noisy data can mislead both humans and AI.
I ported Dan Heller’s CGM Sensor Integrity Detector algorithm from Python to TypeScript (CC BY-NC 4.0). It uses a rolling 30-minute window to analyze reversals, amplitude, and incoherence ratio in the glucose signal, flagging clusters of noisy readings.
The original v5 thresholds were calibrated for earlier Dexcom models. When I ran them against Abigail’s Dexcom G7 data, they flagged 73% of days as noisy. That’s not useful. So I backtested against 73 days of production data and recalibrated. “Poor” days dropped from 58% to 25%, and “good” days went from 27% to 47%.
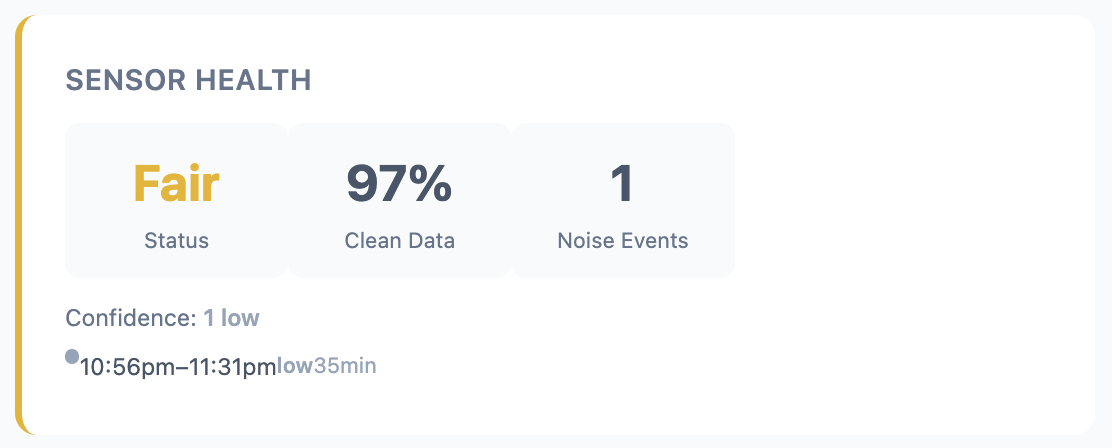
The email now includes a Sensor Health card that shows clean data percentage, noise events, and whether noise preceded any lows.
Bugs and Production Realities
Dexcom has a Share API that makes getting glucose data straightforward. Insulin and carb data is harder. Insulet (the pump manufacturer) doesn’t have a public API, but they share data with Glooko, a diabetes data aggregation platform. Glooko doesn’t have a public API either, but it does have a CSV export in its web UI. So Glucagent runs a headless browser on AWS Lambda every four hours, logs into Glooko, triggers a CSV export, intercepts the download, and parses the insulin and carb records out of it. It’s fragile by nature, and debugging Puppeteer on Lambda has been the single biggest time sink of the project.
What It Costs
The whole platform runs on AWS for roughly $8-13/month.
| Service | What it does | Cost |
|---|---|---|
| DynamoDB | CGM, insulin, and carb storage | ~$2 |
| Lambda | Dexcom, Glooko, and digest runs | ~$3 |
| Bedrock | Claude Opus daily analysis | ~$2-5 |
| SES (Simple Email Service) | Email delivery | < $1 |
| S3 | Raw export archival | < $1 |
I (with Claude Code) built the core platform in about three hours on a Saturday: SST v3 infrastructure, Dexcom ingestion with session caching and dedup, the daily digest with Claude Opus, continuous integration with GitHub Actions, and CloudWatch alarms. The insulin pipeline and sensor integrity work came over the following weeks.
It’s still early. Single patient, email only. A progressive web app and more sophisticated agent features are on the list. But every morning at 7:15, Courtney and I get an email that tells us what happened overnight, connects it to the week’s patterns, and helps us ask better questions at Abigail’s next endo appointment. That’s the whole point.
– John